6502-monitor-plus: Evolution

The first post I made on this blog was about an enhanced/extended version of the Arduino based 6502 address/data line monitor that Ben Eater uses in his video series on building a 6502-based computer on breadboards. I’ve taken that a lot further, since, and figured it might be interesting to walk through the evolution the monitor has gone through since that first post …
So, to the beginning!
(If you just want the latest code, without reading my inane drivel, it’s here).
“Plus”
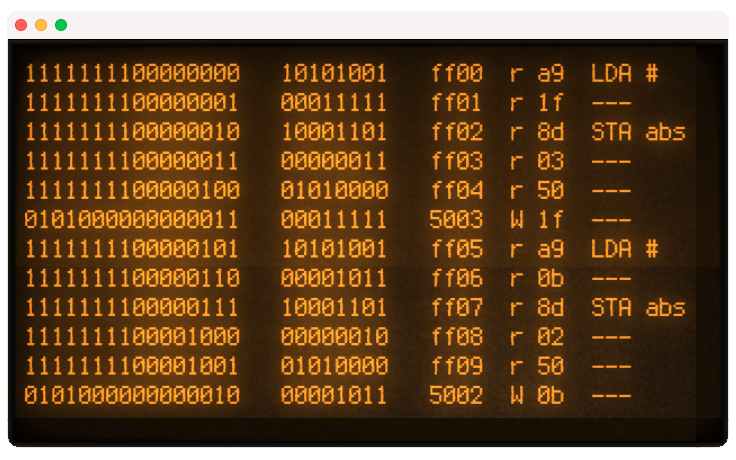
That “plus” version added simple, inline, display of the opcodes being executed, along with their addressing modes, making use of the SYNC line on the 65C02 to determine when a fetch was an opcode. That usefully simplified the code, so it was not much more involved than indexing into an array of opcodes, using the data value as the index, and outputting the result if the SYNC line is HIGH:
Disassembly
A couple of weeks later, I thought it would be interesting to expand that functionality to print what is effective a running disassembly of the code that the CPU was executing including fully-decoded instructions with their actual target address, operand values, and so on:
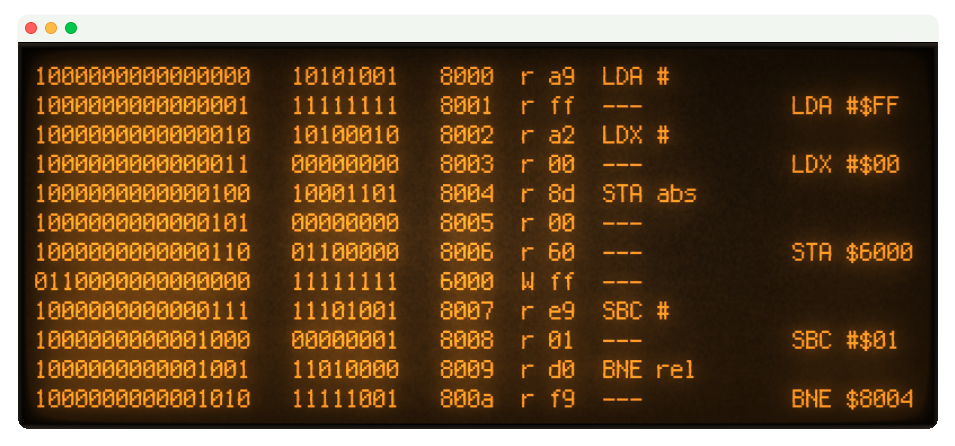
Full-decode is only achieved once all of the operands for an opcode have been seen by the monitor, so output of the “disassembled” instruction occurs with the last byte of the operand appearing on the bus.
This wasn’t a huge change, though perhaps a bit fiddly. Rather than rethinking the opcode table/representation, and including formatting strings and opcode counts directly within it, I took a much simpler approach. I simply derived those details from the addressing mode listed (as a string) for each opcode, which is just a bunch of string inspection/mutation.
It’s short, simple to understand and, since the 65C02 instruction set isn’t likely to change, the somewhat “brittle” nature of the easy approach wasn’t really a factor.
CPU Status Register & Flags
I posted the prior version on r/beneater and u/magic-smoke-maker suggested adding the ability for the monitor to also show the state of the CPU Status Register/Flags.
I liked that idea.
Even though, as I started to think about it, I realized there was no external way to read the status register.
Hell, two of the status bits don’t really exist; one has a constant value and the other is synthesized so executing code can determine if it was a BRK or an interrupt that occurred.
It was quickly apparent that some level of emulation, or emulation-like, behavior was going to be needed to make this work. And I’ll come back to the details of that in a moment, because I DID get it working:
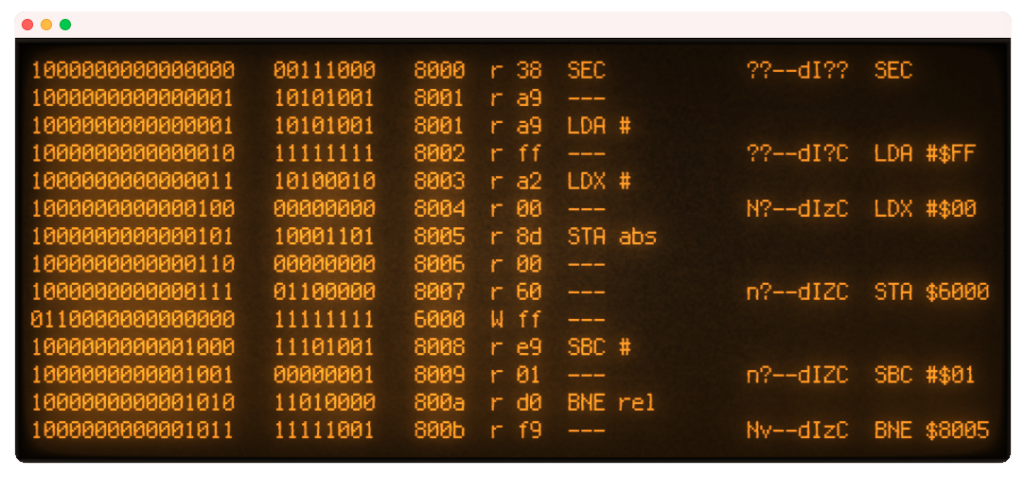
The above is the output from the monitor of the first few clock steps (after the 6502’s seven-cycle reset sequence) from running a simple assembly language program:
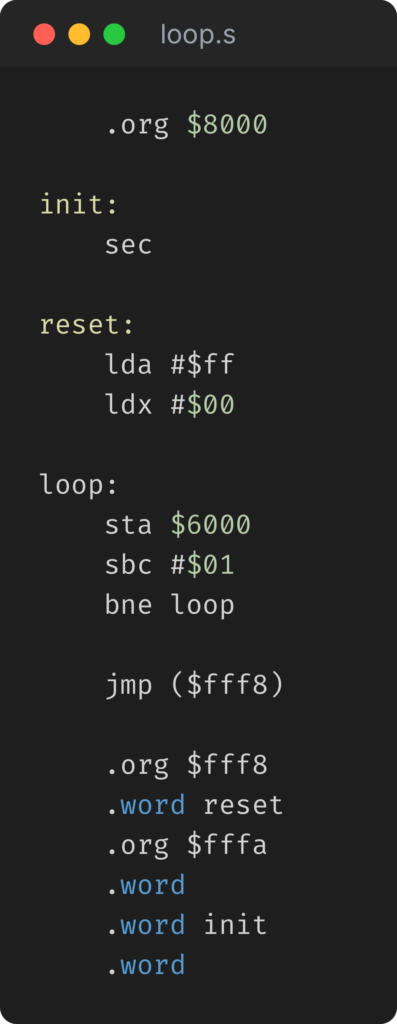
You can see the above code begins at $8000, in accordance with the .org $8000 directive in loop.s.
CPU Status Register/Flag Output
The flags are output next to the instruction they precede. In other words, they show the state of the status register as it is immediately BEFORE that instruction is executed. This allows you to see what that instruction SHOULD do, which is more useful for tracing/stepping through code.
The current state of each of the CPU flags is output, left to right as:
- [N]egative
- [O]verflow
- (always pushed as 1, always shown as -)
- “B” flag (virtual; usually -)
- [D]ecimal
- [I]nterrupt Disable
- [Z]ero
- [C]arry
An uppercase character indicates that flag is SET; lowercase is CLEAR.
A “?” in any flag’s position means the state of that flag is not known; display would be speculative/misleading/wrong.
An “!”” annotating the overall flags display means the modeling of the instruction/flag behaviors is incorrect in some way.
State (De-)Synchronization
Observing and maintaining both initial, and on-going, accurate flag state is 100% dependent on the monitor seeing the whole address and data bus state, atomically, for every executional cycle. Being tied to serial-output limits how fast this can run, and even without that overhead there are limits. Thus, the higher the clock-speed, the greater the likelihood that a cycle will be missed, or will be skewed (address resolved, then changes before the data bus/SYNC pin is read). When that happens, status register tracking will be de-synchronized and it can take a number of fully resolved, observed, cycles to re-sync.
The intended use of this monitor is for lower-clock rate execution and single-stepping, so you can follow what the CPU is doing. The standard “clock module” is more than capable of cycling faster than this monitor can handle. If you get nonsense (non-changing flag-status is a good indication), lower the clock speed.
Theory of Operation
The basics are the same as the original; the devil is in the details.
An interrupt service routine, onClock() samples (captures) the address bus, the data lines, and both the read/write and SYNC lines. That routine then dispatches address decoding, opcode detection (SYNC == HIGH), instruction decoding (getting the full opcode and addressing mode, resolving the addresses/registers, etc.) and formatting and, the hard part, determining the state of the CPU’s status register/flags.
Why is it “hard” to determine the state of the CPU’s status register?
It is not directly accessible; there is, understandably, no bit/pin-level output for those flags on the CPU itself.
This leaves two possibilities for getting those flags:
- Emulation
- Modeling (w/ some computation)
Emulation would be 100% deterministic, but since the point of this monitor is to see what the actual 65C02 hardware is doing, that’s not an option. And if it was, it’d need a full copy of the executing program, and any relevant ROM routines, as well as a full memory model, cycle computation and state model to work at all.
Modeling is, in theory, less involved. It isn’t trivial, and it isn’t as accurate. It is hampered by not being able to know the starting state of the CPU’s status register and has to use a combination of deterministic and inferred/computed instruction behaviors to first get to a “known” flag-state, and then to properly mutate it as instructions are executed (retired).
Most executed instructions have specific, knowable, effects on various status flags that can be “observed”. CLC/SEC are obvious examples; directly affecting the [C]arry flag. Others allow us to “infer” (it is actually deterministic) the status of other flags; BNE/BEQ expose the state of the [Z]ero flag based on whether the branch is taken or not. PHP/PLP/BRK/RTI will actually expose the (six real) status flags on the bus.
ADC/SBC are the trickiest; they have to be computed as their results/effects never appear directly on the bus.
Where I can’t be sure of status, either because the necessary factors have not yet been observed in the running code (e.g., at initialization/reset), flags will show as “?” rather than a “suspected” or “phantom” value. This means that it can take several instructions before the status flag outputs become “reliable”. You can see this in the above sample image/code, as the C, N an Z flags resolve over several instructions.
The Code
If you just want to run this, it is on my GitHub in this repo. There are tags for earlier versions of the code if you want to experience the evolution directly. If you just want the full functionality, pull the latest version (which is what you’ll get by default by downloading the code).
Download the code, open the .ino file with the current version of the Arduino IDE, select a connected Arduino MEGA 2560 R3 board, and compile and upload the sketch.
I’ve heavily commented (perhaps more “narrated”) the actual code. There is much more detail there, if you’re interested in that sort of thing.
Size, Complexity, and Arduino “Build Weirdnesses”
The original version was a few dozen lines of code. That naturally increased as I added features, though those increases were incremental and not huge.
When I decided to add CPU Status Register/Flag output, I first spent the time to refactor the way opcodes and instructions were represented, and what specific data was carried for them in explicit structures. That refactor, even though no different in terms of **what** the monitor did, effectively doubled the code size.
3-400 lines of code in a single .ino file is not that uncommon, and remains quite manageable.
Tripling that is a lot less so.
No problem … I’ll split the code up so its manageable, keeping locality for related behavior and separating things out based on their respective concerns …
Not so fast!
It turns out that the Arduino build tools (IDE or CLI) apply a bunch of preprocessing and merging for multi-file sketches. Effectively, it extracts and generates any necessary function prototypes, add them to a single compilation file, then merges all of the files in the project in ALPHABETICAL order.
While simple, that’s not very useful.
To work, files would have to be merged in caller/dependency order, so the compiler wasn’t compiling code that was dependent on code not yet seen. And the only way around this, using the standard .ino file model, is to use contrived file names for your separate code file to force them to be included in the necessary order.
OR …
The alternative is to minimize what’s in the main .ino file, and move everything else to standard C++ .h and .cpp files, so you have full control of scope, inclusion order, dependencies, etc. You just have to make sure you manually include anything you need that would otherwise be transparently, and automatically, included for you, behind the scenes, if you just used multiple .ino files.
So, that’s what I did.
I think this is, by some margin, the largest (if not necessarily the most complex, though it has to be close) Arduino code I’ve written since I first touched the original Arduino almost 20 years ago.